Drone heat network
HEAT NETWORK THERMOGRAPHY


Heat network thermography
Map the network and detect leaks
Since 2014, we have inspected more than 350 kilometres of heat network. The REX and our regular exchanges with our customers ensure you an accurate inventory of damaged network portions.
We position leaks within 30 centimetres. After each thermal inspection, a meeting is organised to ensure the proper use of the renderings.

Thermal inspection of your networks
The two types of intervention on your heat networks
Emergency inspection: detection of major leaks
The regulations impose a period of 5 working days on us to obtain flight authorisations.
In a major emergency (defusing of the network), we are required to make flight exemptions to intervene within 48 hours.
We can carry out the inspection independently or accompanied by one of your network technicians.
The analysis and rendering of leaks on the heat network are delivered to you the next morning.
Preventive inspection: analysis of the state of the network
The thermal inspection of your heat network takes place in several stages :
- 5A pre-inspection meeting is organised upstream to define the specificities of the network (line to be inspected, technology, etc.)
- 5Network thermography is then carried out by several operators in the middle of the night. (see inspection constraint below)
- 5The assembly, analysis and report are then returned to you two to three weeks after the inspection.
- 5A post-inspection meeting is held when the returns are handed over to assist you in using them.
Orthoplan | Geolocalisation | GIS
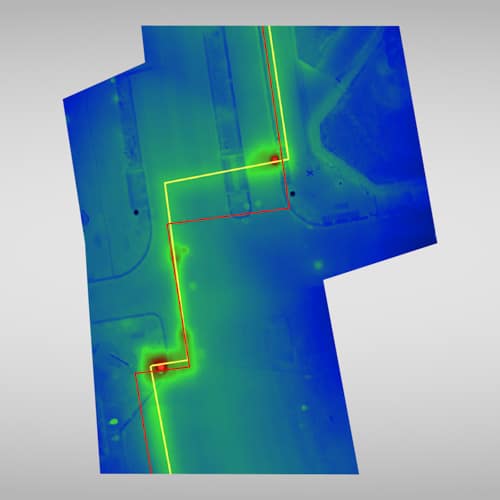
An interactive thermal inspection report
Realisation of two maps
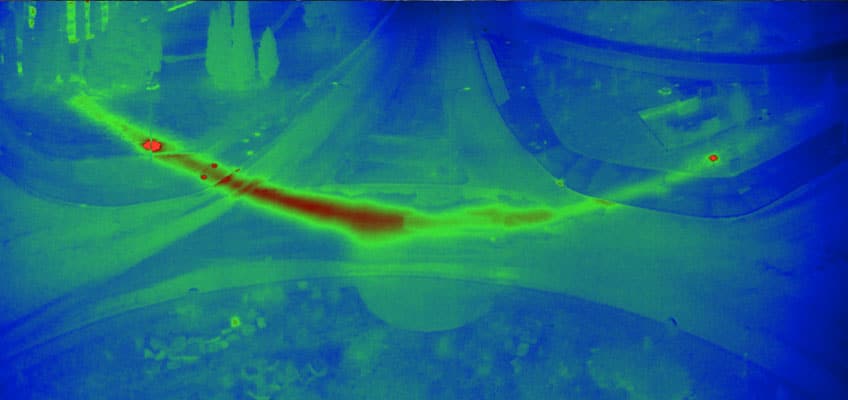
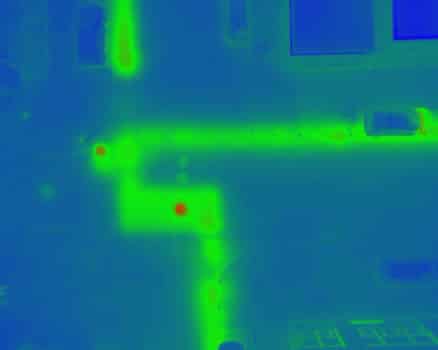
- 5Thermal mapping of the heat network
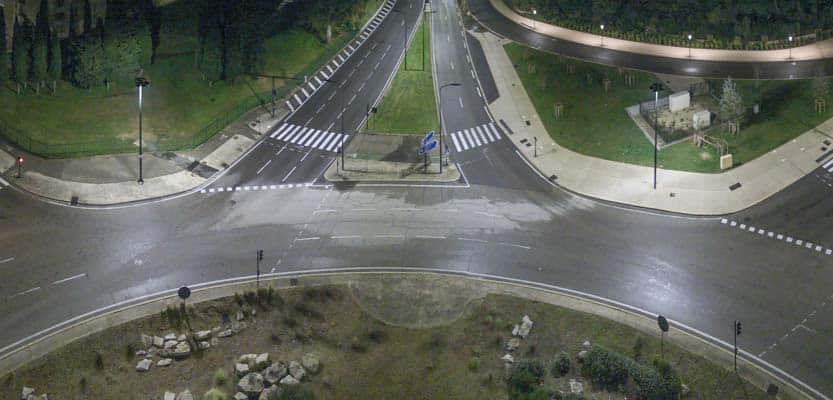
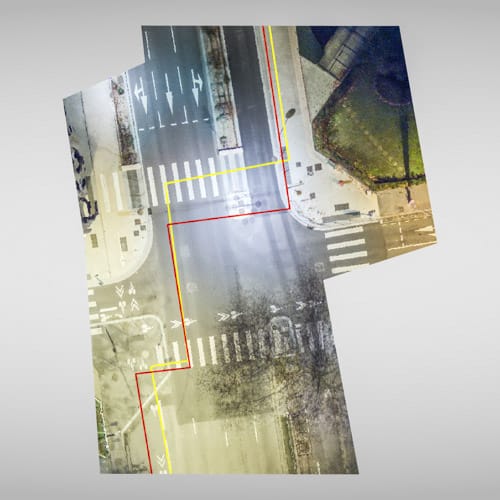
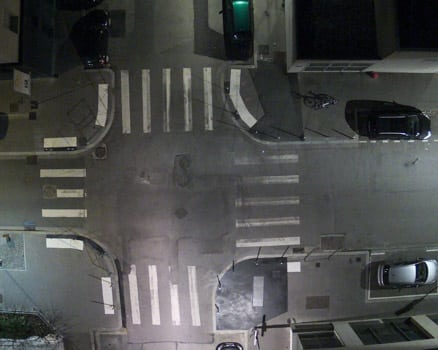
- 5Mapping in the visible domain
These thermograms are then assembled, georectified and analysed to show the anomalies in order of relevance.
Mapping in the visible domain is also carried out to observe the surface condition of the soil.
This second orthophotography allows us to refine the analysis of the network.
Our technologies and our skills allow us to obtain net results from the evolution of heat networks, whatever their size.
The thermal anomalies detected are clearly visible on the thermal image and, unlike other methods, the examination of the installed networks is possible without intrusion and during their normal operation.
- 5Thermal sensitivity less than 34 mk
- 5Temperature range from -40 °C to +650 °C
- 5Embedded GPS allowing the georeferencing of infrared images
- 5Simultaneous thermal / RGB shots.
Exploitation of renderings
We offer two forms of rendering: : → A delivery of the database of these anomalies as well as the thermal and RGB mapping of the network in a format that can be integrated into your GIS. → Easier operation on a web platform, requiring no installation of third-party software.The conditions for a good inspection of heat networks

Winter temperature installed
Prohibited solar radiation

Inspection from October to March
Our expertise in aerial thermography also extends to other sectors of activity :

- 8, rue de la Madeleine - 69007 LYON
- 04 37 28 67 25
- contact@studiofly.fr